
Microblink Introduces Conversion Analytics to Help Improve Identity Verification Completion Rates

Traditionally, identity verification teams have measured success primarily through accuracy, fraud detection rates and processing speed. Those metrics remain essential, but they don’t tell the entire story of how an identity verification process performs in production.
However, a verification system can be highly accurate and still lose legitimate customers along the way. A user might struggle to capture a document, encounter repeated prompts or abandon the process before a verification decision is ever made. From the perspective of traditional reporting, that interaction may simply appear as another incomplete session.
But for the business, it represents something more significant: a potential customer who never made it through onboarding, a transaction that never happened or an account that was never opened.
The challenge is that many organizations already have the data needed to investigate these problems. What they lack is a practical way to turn that data into answers.
The Difference Between Knowing Your Conversion Rate and Understanding It
Consider a financial institution that notices a decline in identity verification completion rates. Its dashboard shows that fewer applicants are successfully finishing onboarding than the previous month.
That’s useful information, but it leaves the team with several questions. Are users abandoning the process during document capture? Are they reaching a verification step and failing to complete it? Is the problem affecting the entire customer base, or is it concentrated at a particular stage?
The challenge isn’t necessarily a lack of data. It’s that the available information doesn’t clearly show how users move from one step to the next. Journey-level analytics changes that conversation.
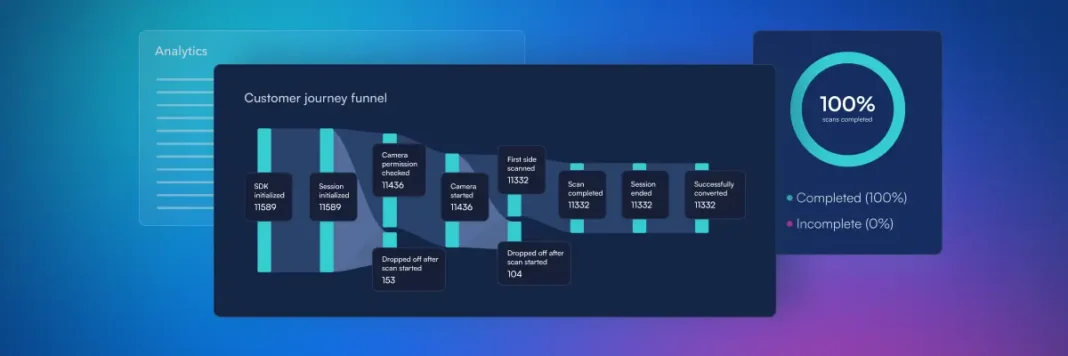
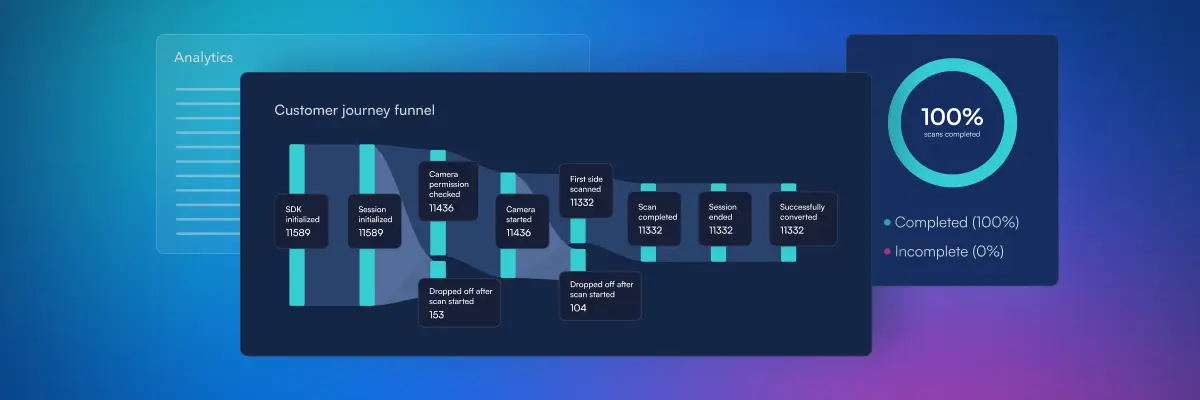
By visualizing the paths users take through verification, teams can identify where people continue, where they stop and which stages deserve closer attention. Instead of investigating the entire onboarding experience, they can focus on the specific points where completion rates begin to deteriorate.
That doesn’t mean analytics automatically explains every abandoned session. But it provides a more useful starting point for determining what happened and what to investigate next.
Turning Verification Friction Into Actionable Insights
One of the most valuable applications of conversion analytics is helping organizations distinguish between problems that appear similar in traditional reporting.
For example, two businesses might report identical verification completion rates but face very different challenges.
At the first company, most users complete document capture successfully, but a significant number abandon the process at a later verification step. At the second, the greatest drop-off occurs before users finish capturing their documents. The overall conversion numbers may look the same, but how to respond is not.
The first company may need to examine how its verification requirements or subsequent steps affect the customer journey. For example, users might abandon the process because they weren’t told in advance that they’d need to scan an identity document or payment card, making the sudden appearance of a camera feel unexpected. The second company may need to investigate its document capture experience, including whether settings such as blur sensitivity are too restrictive and causing users to repeatedly encounter «Eliminate Blur» messages. In both cases, understanding where users drop off can help teams identify specific changes to investigate rather than making broad assumptions about what’s causing friction.
From Reporting Problems to Investigating Their Causes
A visual representation of the verification journey makes it easier to spot unusual patterns and areas of abandonment. But identifying a drop-off is only the beginning. Teams still need to determine whether it reflects a technical issue, confusing instructions, an expected security requirement or some other factor.
For example, if users are leaving at a particular stage, teams can review the available information and explore potential explanations rather than beginning with a blank slate. That can help product, engineering and operations teams collaborate around a specific issue instead of debating which part of the overall process might be responsible.
It also creates a more disciplined approach to optimization. Teams can identify a potential problem, investigate the cause, make an appropriate change and then assess whether the verification journey improves.
Bringing Conversion Analytics Into Microblink Command Center
At Microblink, we’ve been building toward this approach by making verification analytics more accessible within the Identity Intelligence OS. Rather than relying exclusively on high-level completion data, our clients can now explore a visual representation of the journey to see how users move between stages and where they drop off. This can be broken down by cohort, such as specific document type or geography.
The experience also includes built-in guidance to help customers investigate potential causes of abandonment and identify opportunities to improve conversion.
For product and operations teams, this creates a more direct connection between identity verification performance and the customer experience. Instead of treating verification as an isolated technical component, they can begin evaluating how its individual steps contribute to broader business outcomes.
For fraud and risk teams, the same visibility can support more informed conversations about the relationship between security requirements and customer friction.
And for existing Microblink customers, it provides an opportunity to get more value from the verification technology they’re already using.
Analytics Should Be Part of an Ongoing Process
A verification experience that performs well today may encounter new challenges several months from now. That’s why conversion optimization shouldn’t be treated as a one-time project.
Organizations need a way to regularly examine how their verification journeys are performing, identify emerging sources of friction and determine whether changes are producing the intended results.
A practical starting point is to establish a baseline for the current journey, identify the stages with the greatest abandonment and prioritize a small number of issues for investigation. After making changes, teams can review subsequent performance and determine whether further adjustments are warranted.
Over time, this approach helps make identity verification an actively managed part of the customer experience rather than a process that receives attention only when completion rates decline.
Start With the Data You Already Have
The identity verification industry has spent years improving the technology used to establish whether someone is who they claim to be. That work remains essential, especially as generative AI and increasingly sophisticated fraud attacks raise the stakes for digital trust.
But businesses also need to understand what happens to legitimate customers as they move through the process.
Accuracy tells organizations how well verification technology makes decisions. Conversion analytics helps them understand how effectively customers reach those decisions in the first place.
Visit the Microblink Developer Hub and explore the Analytics tab to learn more about these new capabilities. You can also contact your Microblink account manager to discuss availability and how to get started.